Introduction
There are a number of ways of interpreting data, various inferential statistics allows us to analyse dAta from sample proportions and make certain assumptions about a population based on our results. Methods for calculating averages are not discussed here.

Data sets that are plotted on a graph with the individual data values on the x-axis and number of values on the y-axis are said to be normally distributed if they have the approximate 'bell-curve' shape above where the mean value, the median value and the modal value are approximately equal.
The mean is the average value for a data set, where all values are added together and divided by the total number of values.
The standard deviation gives a measure of how much variation there is from the mean.
The empirical rule states the approximate percentage of data of data that lies within a number of standard deviations from the mean. From the image above 68% lies within one standard deviation of the mean, 95% lies within two standard deviations and 99.7% lies within three standard deviation of the mean.
Sample overview & Calculator function

Z-scores
Z-scores represent the number of standard deviations that a value lies above or below the mean and are very useful as they can be used to compare different individual values in entirely different data sets.

A z-score which is equal to zero occurs when the individual value is equal to the mean value.
Z-scores become very useful when trying to work out the probability that a value lies above or below another value. Using the probability distribution below, where the area under the curve is one, and the z-scores in the log tables, a percentage can be obtained which tells us the percentage of data which is less than (area under the curve to the left) of a particular z-score.

To find the probability that any value is less than a certain value (which is the same as finding the percentage of data less than the original value), we must find the z-score of our original value, then look this up in the z-scores section of the log tables. Lets assume the value has a z-score of 1.5.

Here we can see that the answer from the tables for z = 1.5 (highlighted in yellow) is 0.9332, which means that 93.32% of data is less than our value - whose z score is 1.5. Note: as the area under the curve is one, to find the percentage which is greater than 1.5 we subtract the above value from one. i.e.: ![]()
If we are asked to find the percentage between two z-scores:

LC solution 2016


LC solution 2017


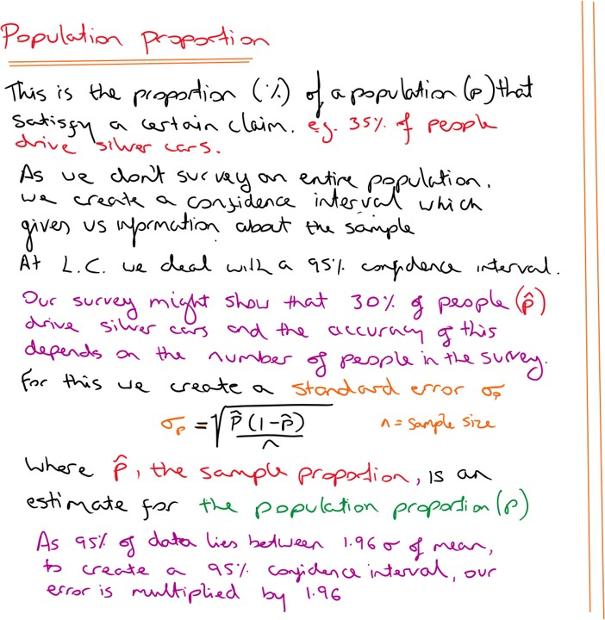
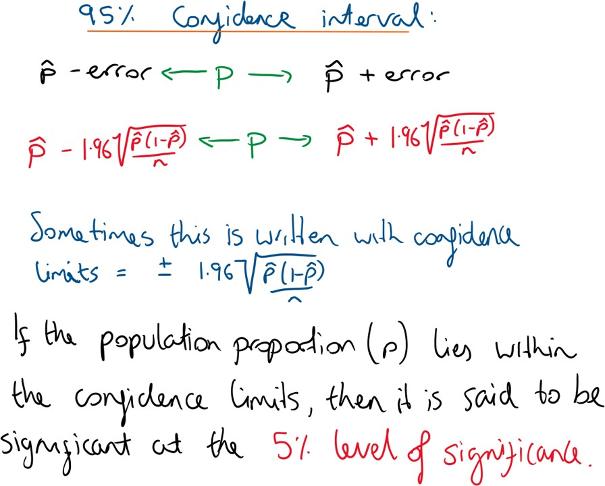
Confidence limits

LC Solution


Sample Means

LC solution 2015


LC Solution 2016


LC solution 2017

