Energy Profile Diagram
The effect of using a catalyst on rate can be demonstrated using an energy profile diagram. The catalyst provides an alternate route with a lower activation energy.
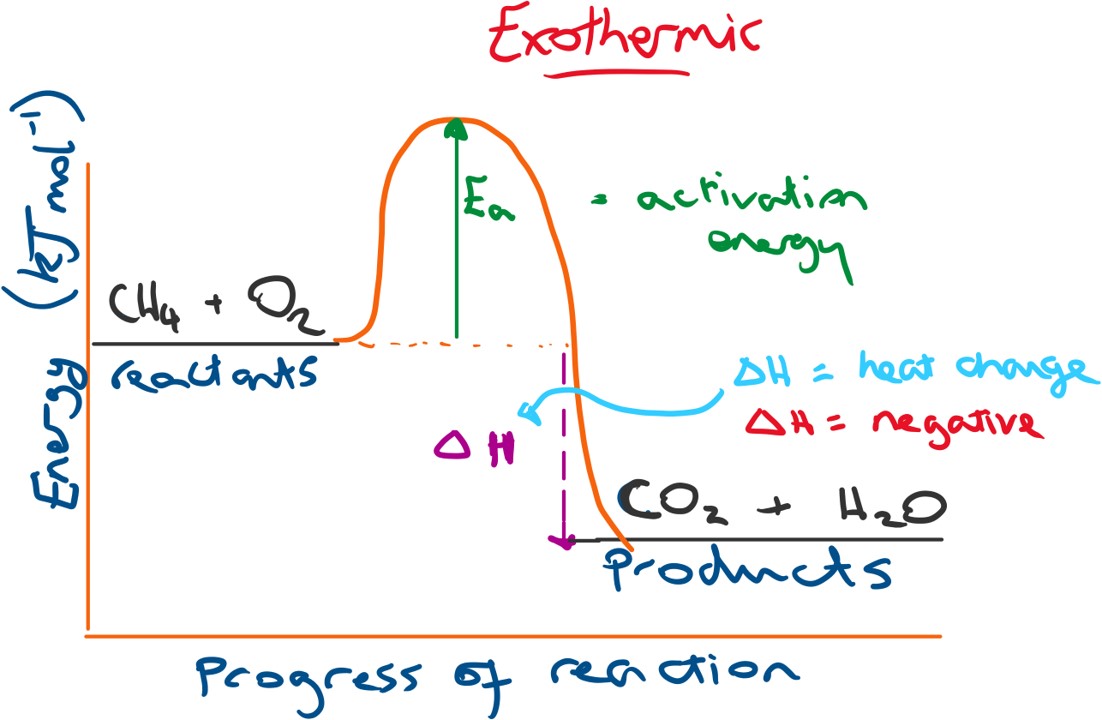
Below is a profile diagram for an exothermic reaction. The change in energy (ΔH) will be negative because the products have a lower energy than the reactants. N.B. energy change = energy of products - energy of reactants.
This results in that excess energy released into the surroundings after the reaction and so we observe a heat or energy gain for the surroundings)
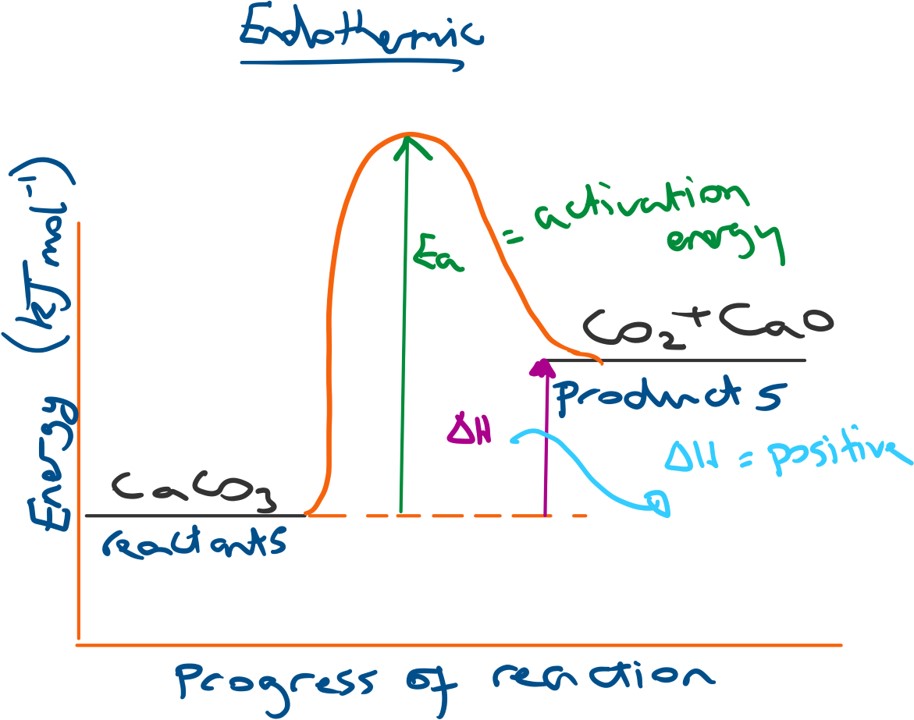
For an endothermic energy profile diagram the products will have a higher energy than the reactants and so the overall change in energy (ΔH) will be positive (thus energy is taken into the system from the surroundings, resulting in heat loss).
This results in energy being brought in from the surroundings and so we observe a heat or energy loss from the surroundings).